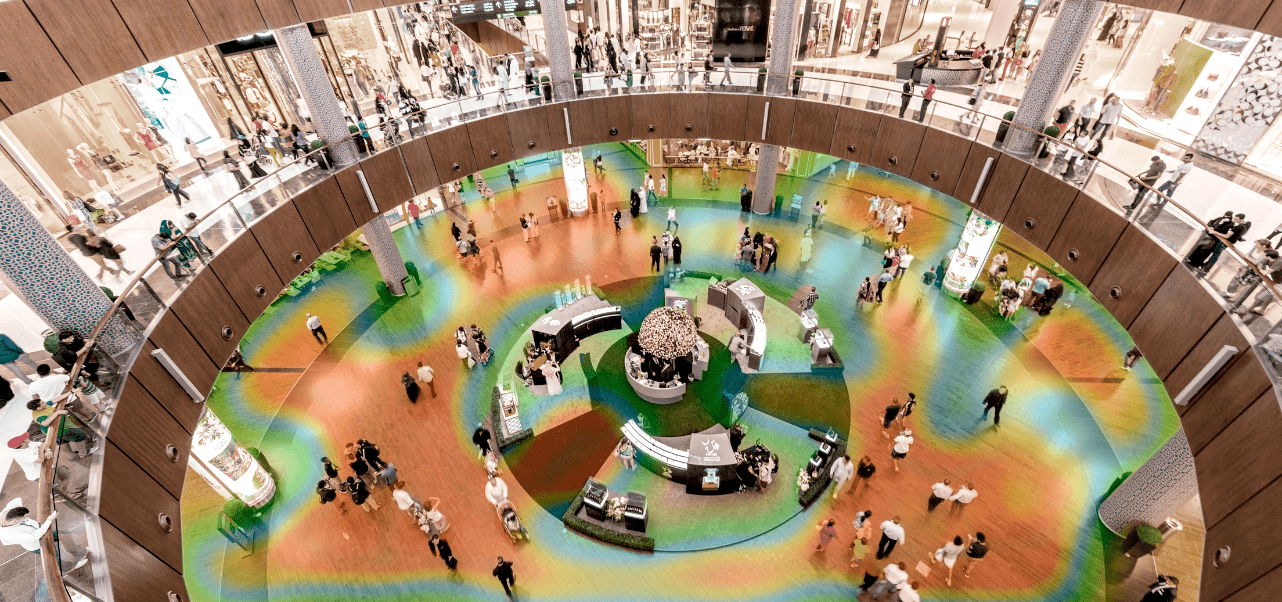
Heat Map
The heat map provides information on the most visited places in the store, displays hot and cold zones depending on the activity of the customers

Advantages
Analysis of warm and cold areas in the shopping centers, and public places
Analysis of the buyer's activity at retail space
Analysis of the customer reaction to the ads, and promotions, or external banners
01 Heat map helps to track the flow of people in a store, or shopping center and analyze customer activity
02 The module provides information for analyzing the effectiveness of advertising
03 The module helps with a product placement on the shelves to attract more customers
04 Provides information about most visited places in store
05 Generation of the reports for an hour, a day, a week, or selected period of time
06 Cross-platform and multilingual interface
How It Works
01
Data from CCTV cameras are processed by special algorithm
02
The algorithm measures the intensity of the people flow passing through the control zones
03
A heatmap is formed, which shows the intensity and density of client flow at the different periods of time